

The experimental rig described in paragraph "2.1. Equipment description" is fitted with a silica window which allows direct observation and video recording from outside (see Figure 22).
The diameter of the sample R-type thermocouple wire chosen was 25 µm. The wires were coated with silica as in previous experiments. The furnace temperature was set at 700 °C, as it was intended to run the experiments at the highest possible temperature. However, intense heat emitted from the furnace did not allow the furnace temperature to rise above such a value without causing damage to the video camera. Indeed the camera was cooled by a fan.
Five experiments with droplets of varying initial diameter were performed with every oil sample. Initial droplet diameters ranged from 0.80 to 1.13 mm. A Hitachi CCTV camera fitted with a Computar Zoom Lens 18-108/2.S Japan Lens was used, with which enlargements of 20.5/1 could be achieved at the desired focal length. The camera was connected to a Hitachi B/W monitor and a JVC BR-S611E video cassette recorder.
Subsequently, the variation of the droplet diameter during the Pre-ignition Delay was evaluated on a frame-by-frame basis by using an image analysis computer package named "OPTIMAS". Calibration was achieved by filming graph paper of known gridsize.
Video recordings were obtained at a speed of 25 frames per second. Therefore, there is a 0.04 seconds interval between two successive images.
The variables under consideration were time and droplet diameter. Since Pre-ignition Delay varies according to the initial diameter both variables were normalised:


M3
G3
G4
G5
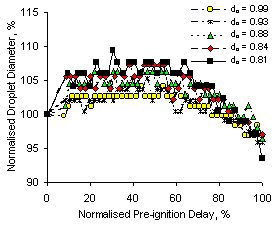
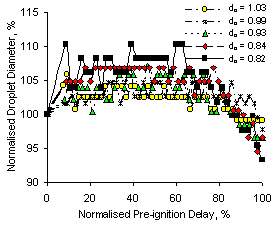
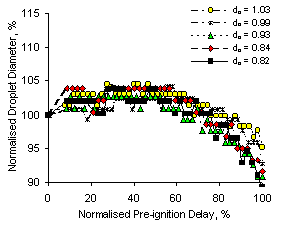
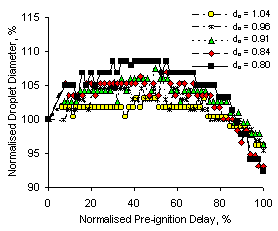
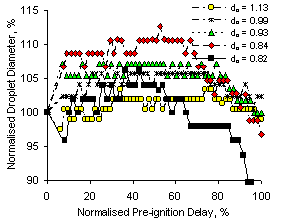
Figure 32: Graphs showing the evolution of the Normalised Droplet Diameter with respect to the Normalised Pre-ignition Delay
All samples except G3 showed the extent of swelling to be inversely proportional to the initial droplet diameter. Thus small droplets presented larger proportional swelling than larger ones. Fuel G3 does not follow such behaviour pattern, but swelled to a similar extent regardless the initial droplet diameter.
Contraction starts in the second half of the Pre-ignition Delay. It is faster for fuel G3 than for other samples. Droplets of fuel G3 recover 100 % of their original size at approximately 75 % of the Pre-ignition Delay (as an average), whilst others reach the same percentage at approximately 85-90 % of ti. Results from G5 show contraction to proceed back to the initial droplet size while approaching the end of the Pre-ignition Delay.
The reduction of the droplet diameter continues until the onset of the homogeneous ignition. Ignition occurs when the droplet diameter is reduced to 95 % of its original value, except for fuel G3, whose size is reduced to nearly 90 % of do as contraction starts at an earlier stage. The decrease of droplet volume at the point of ignition is, in most cases, lower than 0.1 mm3.
No disruptive behaviour was observed during the Pre-ignition Delay. The droplet size was seen to vary uniformly as the Pre-ignition Delay progressed. In addition, the violent, sudden changes in droplet size that characterise fuels which contain heavy fractions were not observed (Burgess and Ghaffari (1989), Lightman and Street (1981), Malik and Burgess (1985), Marrone et al. (1984)) . Unlike other heavy fuels (Burgess and Ghaffari (1989), Malik and Burgess (1985)) , ignition does not start at a specific location on or around the fuel droplet, but uniformly in the fuel-air cloud that surrounds it. Once ignition has started an envelope flame is established.
Finally, video recordings confirm the presence of coke residues in only one of the samples studied, M2. The existence of coke residue is denoted by a red glow which begins after the extinction of the flame.
 Previous |  Table of Contents |  Next |