 ). The mathematical expressions are based on data for liquid fuel combustion published in "Technical Data on Fuel", by H.M. Spiers (Spiers (1977)) .
The equivalence ratio is defined as:

Values below unity mean fuel-lean (oxidising) combustion conditions, whereas equivalence ratios above unity indicate fuel-rich (reducing) conditions.  = 1.000 indicates stoichiometric conditions.
The theoretical (ie at  = 1.000) air requirements (Ao, nm3/kg fuel) and the theoretical volume of wet combustion gas (Vo, nm3/kg fuel), produced in the combustion of a fuel are related to the net calorific value of the fuel by the formulae:

where nm3 represents volume at normalised conditions, ie at 0 °C and 1 atm, and CN is the net calorific value of the fuel, kJ/kg fuel.
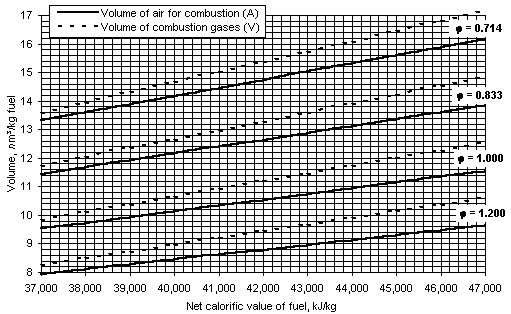
The actual volume of air used for combustion (A, where nm3/kg fuel) and the volume of the wet combustion gases (V, nm3/kg fuel) for various equivalence ratios are represented in Figure 38 (Spiers (1977)) .

Assuming a linear relationship of A and V with the equivalence ratio, the following formulae can be obtained for any value of  and net calorific value with an estimated error lower than 1 %:

The temperature of the furnace wall was set at 900, 1,100 and 1,200 °C. Fuel injection was achieved through a coaxial external-mix twin-fluid atomiser (see Figure 33). The fuel cap used was 1650ss, with an internal diameter of 0.75 mm, and external diameter of 1.3 mm. The air cap used had designation 64ss. The diameter of its orifice was 1.59 mm.
Following previous work on the same rig by Graville (Graville (1993)) , a constant flow rate of atomisation air was set at 23.2 g/min at 1.6 bar-g. When used with an air cap of 1.59 mm diameter it produces an air velocity greater than 325 m/s when leaving the nozzle annulus, thus creating the fuel spray.
The atomisation air stream creates a fuel-rich, conical jet of equivalence ratio 2.25 immediately after injection, prior to mixing with the stream of secondary air.
Runs were performed at overall equivalence ratios of 0.714, 0.833, 1.000 and 1.200. The flow rate of secondary air was altered to meet the requirements of equivalence ratio in the combustion chamber.
Experiments in fuel-rich conditions ( = 1.200) were not performed at 1,200 °C furnace wall temperature. The flame temperature was low in some sections of the furnace and the furnace heating elements were not able to supply enough current to keep the set point.
From the values of the net calorific value provided in the analyses of the fuels the following secondary air mass flow rates were calculated for various equivalence ratios ( ):
):
Equivalence ratio ( ) )
| Secondary air mass flow rate, g/min |
|---|---|
| 0.714 | 41.2 |
| 0.833 | 32.2 |
| 1.000 | 23.3 |
| 1.200 | 15.5 |
Each fuel investigated presented different handling characteristics. Fuel M1 is in its liquid state at room temperature, and therefore no further heating was needed in order for it to flow. However, fuel G1 is a highly thixotropic fluid which does not flow at room temperature. Heating above 55 °C and agitation decrease its viscosity and allows it to flow. Supplementary heating was provided around the pumps.
It was observed that a yellow layer appears on the surface when fuel G1 is stirred within the fuel can. It was presumed that this layer could be formed by sulphur released by the fuel. Agitation was then increased to incorporate such a layer back into the fuel.
Based on the work published by Graville (Graville (1993)) the viscosity of the fuels was set at 46 cSt at the atomiser nozzle. This was achieved by setting the atomiser block temperature at certain values according to the viscosity data provided in "Appendix II". These temperatures were: M1: 33.5 °C, G1: 48 °C.
Fuel M1 required extra cooling of the atomiser block in order to achieve the optimum 33.5 °C, as radiation from the flame and the furnace walls tended to increase the temperature above this value. This was attained by increasing the flow rate of cooling water in the atomiser block.
The results from experiments at three furnace wall temperatures and four equivalence ratios are plotted versus distance from the atomiser nozzle in the following figures. The data points are represented by vertical error bars, whose size denotes the standard deviation of the measurements. In the case of the NO2 graphs the standard deviation is not provided as its concentrations are calculated by subtracting the concentration of NO from that of NOX.
 Previous |  Table of Contents |  Next |