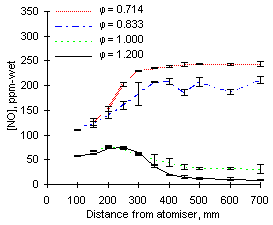
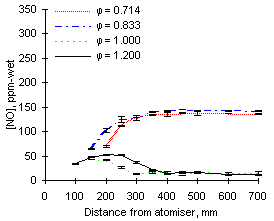
The formation and emissions of NO, represented in Figures 39 and 40, vary greatly with the equivalence ratio for both fuels investigated.
Minimum emissions of nitric oxide are attained in fuel-rich mixtures ( = 1.200). Measurements in stoichiometric and fuel-rich conditions at short distance suggest that NO is formed at distances lower than 150 mm in appreciable amounts (approximately 77 ppm-wet from fuel M1 and 42 ppm-wet from fuel G1), undergoing subsequent decay to exhaust levels.
Higher values of NO emissions are obtained in fuel-lean combustion environments. Values obtained from fuel G1 at  = 0.833 are similar to those at
  = 0.714, approximately 140 ppm-wet. However, when fuel M1 is burned at
  = 0.833 it produces less NO than at
  = 0.714.
| 
|
| Figure 39: NO concentrations from fuel M1 at 900 °C
| Figure 40: NO concentrations from fuel G1 at 900 °C
|
The emissions of NO depend on the nitrogen content of the fuels. Analyses provided by Repsol Petróleo S.A. (see "Appendix II") show that the amount of nitrogen contained in fuel M1 (3,231 ppm N) is much greater than that in fuel G1 (1,619 ppm N). Consequently, greater NO emissions are caused by fuel M1 than from by fuel G1.
On the contrary, the conversion of fuel-N into NO increases as the fuel-N content decreases. A graph showing fuel-N conversion to NO is shown in Figure 45. For fuel M1 (3,231 ppm N) the exhaust concentration of NO at  = 0.714 (where formation of NO2 is negligible) reaches 253 ppm-wet. Such a value represents 45 % conversion from fuel-N. Fuel G1 (1,619 ppm N) produced 127 ppm-wet NO at exhaust, which accounts for 50 % conversion. It is assumed that at 900 °C furnace temperature all NO detected originated from nitrogen in the fuel (see chapter IV for determination of thermal-NOX).
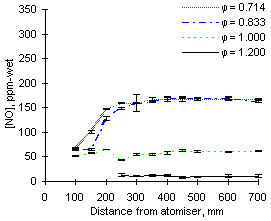
At 1,100 °C furnace wall temperature the concentrations of NO measured are again higher for the fuel with a greater nitrogen content, ie M1. At  = 0.714 the exhaust NO concentration reaches 325 ppm-wet for fuel M1 (94.4 % fuel-N to NO conversion) whereas only 167 ppm-wet (95.7 % conversion) are obtained from fuel G1 (see Figures 41 and 42)
NO from fuel M1 is formed at a much faster rate than from fuel G1. Approximately 210 ppm-wet are formed between 150 and 250 mm from the atomiser nozzle from fuel M1, whereas only 100 ppm-wet are formed in the same distance from fuel G1.

| 
|
| Figure 41: NO concentrations from fuel M1 at 1,100 °C
| Figure 42: NO concentrations from fuel G1 at 1,100 °C
|
Comparison of Figures 40 and 42 shows that at 900 °C furnace wall temperature the formation of NO occurs at shorter distances at  = 0.833 than at
  = 0.714. However, at 1,100 °C the trend is reversed and greater amounts of NO are formed at shorter distances at
  = 0.714 than in less fuel-lean conditions (
 = 0.833).
| 
|
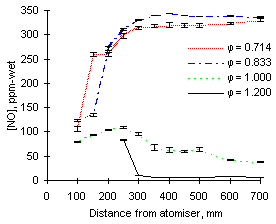
| Figure 43: NO concentrations from fuel M1 at 1,200 °C
| Figure 44: NO concentrations from fuel G1 at 1,200 °C
|
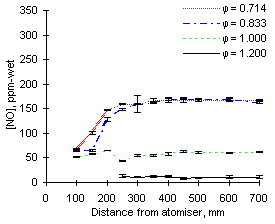
The experimental results are shown in Figures 43 and 44. At this furnace wall temperature the experimental readings of NO at fuel-lean conditions ( = 0.714) did not differ greatly from those at 1,100 °C. The flame temperature is high enough to transform most fuel-N into NO, but low enough so that no thermal-NO is formed.
The conversion of fuel-N into NO shows a dependence on both the fuel-N content and the furnace wall temperature. A graph showing fuel-N conversion to NO from both fuels is given in Figure 45.
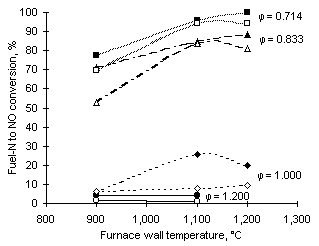
Figure 45: Fuel-N to NO conversion at exhaust from all experiments performed (open symbols: fuel M1; solid symbols: fuel G1)
At fuel-rich conditions ( = 1.200) the conversion of fuel-N into NO reaches minimum values below 5 %. The conversion is higher at stoichiometric conditions.
The conversion of fuel-N into NO increases drastically in fuel-lean conditions ( = 0.833 and 0.714). In these environments the formation of NO is favoured by the high concentration of oxygen-containing species. The highest conversions were attained at low equivalence ratios (fuel-lean conditions) and high furnace wall temperatures. At
  = 0.714 and 1,200 °C furnace wall temperature, the conversion of fuel G1 reaches values close to 100 %.
In the case of fuel M1 at  = 0.714 and 0.833, the transition from 1,100 °C to 1,200 °C causes a small reduction of fuel-N conversion.
Figure 45 also shows that in general M1, the fuel with higher N content (open symbols), achieves lower conversion.
Pollutant formation and interaction in the combustion of heavy liquid fuels
Luis Javier Molero de Blas, PhD thesis, University of London, 1998
© Luis Javier Molero de Blas
 = 1.200). Measurements in stoichiometric and fuel-rich conditions at short distance suggest that NO is formed at distances lower than 150 mm in appreciable amounts (approximately 77 ppm-wet from fuel M1 and 42 ppm-wet from fuel G1), undergoing subsequent decay to exhaust levels.


