3. Experimental results
The flame temperature traces obtained are shown in Figures 106 through to 109.
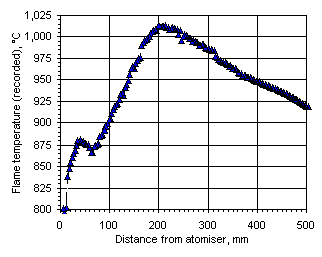
Figure 106: Flame temperature profile recorded from Orimulsion at  = 0.833
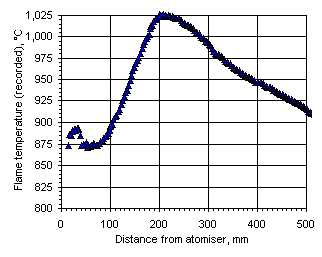
Figure 107: Flame temperature profile recorded from fuel M1 at = 0.833
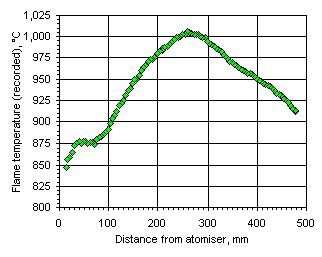
Figure 108: Flame temperature profile recorded from fuel M1 at = 1.000
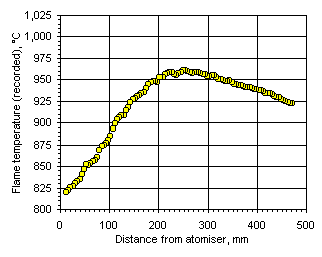
Figure 109: Flame temperature profile recorded from fuel M1 at = 1.200
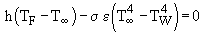
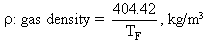
These graphs show that the recorded values of the flame temperature were excessively low for the combustion systems considered. Thus, corrections for heat losses by radiation and convection were applied. The calculations were based on an algorithm reported by Bradley and Matthews (Bradley and Matthews (1968)) . At steady-state conditions there should be no net gain or loss of energy in the thermocouple, and thus both convective and radiative effects would balance each other. Thus, convective and radiative heat transfer are taken into account by means of the following formula:
where (Perry and Green (1984)) :
TF : flame temperature
T : infinite gas temperature, ie that recorded by the thermocouple
TW : furnace wall temperature = 900 °C = 1,173 K
 : Stefan-Boltzman constant = 5.67×10⁻⁸ W/m2 K4
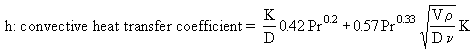
K : air thermal conductivity = 5.4874×10⁻⁵ TF - 0.001862, W/m K in the range of temperature considered
D : thermocouple diameter = 3 mm = 3×10⁻³ m
Pr: Prandtl number = 0.67314 - 3×10⁻⁵ TF, in the range of temperature considered
V : gas velocity, a function of the flame temperature TF and the mass flow rate
 = gas viscosity, which is a function of the flame temperature = 3.2143×10⁻⁸ TF + 1.2439×10⁻⁵, kg/m s
 = total hemispherical emissivity of the thermocouple. Information on this variable was obtained from INCO (INCO (Private communication)) . A linear relationship was assumed between the total hemispherical emissivity and the temperature recorded by the thermocouple (infinite gas temperature) in the form = 1.9825×10⁻⁴ T + 0.5734
Thus the flame temperature can be calculated by:
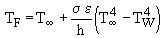
Since the Prandtl number, gas density, gas velocity and convection coefficient are, in turn, functions of the flame temperature, reiterative calculations were necessary in order to estimate those. The correct value of the flame temperature was achieved when the iterative correction procedure did not modify its value.
In all of the traces obtained there is considerable scatter in the data in the first 100 mm after the atomiser nozzle. Spurious readings are possibly caused by turbulence in this zone of high recirculation. Also in this zone, radiation from the furnace walls, set at 900 °C, would predominate over the cooler fuel-air mixture, thus providing inaccurate measurements of the gas temperature.
A precise temperature profile in the heating-up period (0 to 100 mm) was also needed as discrete values of the flame temperature are required to model the CSTR region of the drop-tube furnace (see section "2.1 Representation of the flow dynamics in the drop-tube furnace"). Further corrections were performed on the temperature traces in this zone as described next.
The fuel was injected at approximately 25 °C. The flame temperature in the heating-up period was subsequently calculated by means of a second order polynomial, relating flame temperature to the distance from the atomiser nozzle. At 100 mm the temperature calculated by the polynomial should match that in experimental runs. The use of a second order function is consistent with temperature traces obtained from experiments with the Single Suspended Droplet technique (see chapter II).
The temperature profiles shown in the following graphs were obtained when these corrections were included:
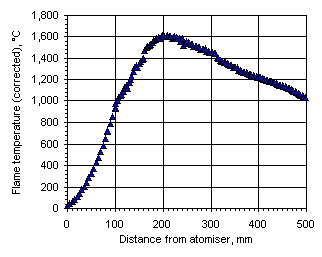
Figure 110: Flame temperature profile from Orimulsion at = 0.833
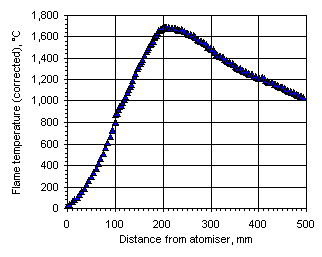
Figure 111: Flame temperature profile from the heavy coker gas oil M1 at = 0.833
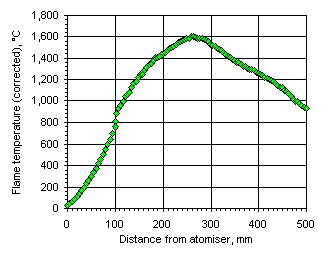
Figure 112: Flame temperature profile from the heavy coker gas oil M1 at = 1.000
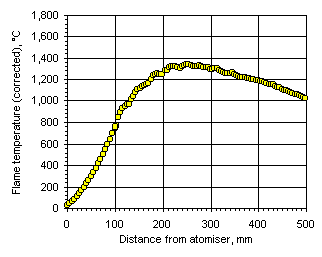
Figure 113: Flame temperature profile from the heavy coker gas oil M1 at = 1.200
In all cases the flame temperature increased steeply from the initial fuel temperature, ie 25 °C, up to a maximum value, decreasing subsequently to values close to those of the furnace wall at a slower rate. The maximum temperature and its location varied according to the equivalence ratio. In fuel-lean conditions ( = 0.833) the flame temperature has a maximum value of 1,691 °C at 201 mm from the atomiser nozzle. As the equivalence ratio in the furnace was increased the maximum flame temperature decreased, and also the maximum temperature was reached at a longer distance from the atomiser nozzle. In stoichiometric conditions the maximum flame temperature was 1,599 °C at 262 mm from the atomiser nozzle, whereas at = 1.200 the maximum value of the flame temperature registered was 1,329 °C at 276 mm from the atomiser.
The temperature profile obtained from Orimulsion burned at = 0.833 showed a similar pattern to that of the heavy coker gas oil M1. The flame temperature rises more rapidly in the initial heating-up period than with fuel M1, since the flame temperature at 100 mm from the atomiser nozzle was higher than that of fuel M1. The water contained in the fuel evaporates shortly after entering the furnace. Micro-explosions produce secondary atomisation that enhance the combustion rates in these early stages of the flame. However, in the plug flow region the flame temperature increased at a lower rate than fuel M1 (7.9 °C/mm whereas the heating rate with fuel M1 was 9.5 °C/mm) until reaching the maximum flame temperature, 1,614 °C at 212 mm from the atomiser nozzle. This value is lower than that obtained from fuel M1 burned in similar conditions. A possible explanation for this phenomena is that the flame is cooled by the evaporation of water in the fuel. Also, radicals released by the water may have a similar effect.
Pollutant formation and interaction in the combustion of heavy liquid fuels
Luis Javier Molero de Blas, PhD thesis, University of London, 1998
© Luis Javier Molero de Blas


