 = 0.714 and 0.833) will be considered in this section. In stoichiometric and fuel-rich conditions the measured concentrations of carbon monoxide exceeded the instrumental range (1 %).
Only results obtained in fuel-lean conditions ( = 0.714 and 0.833) will be considered in this section. In stoichiometric and fuel-rich conditions the measured concentrations of carbon monoxide exceeded the instrumental range (1 %).
Values of CO concentration obtained in fuel-lean conditions and short distances are affected by large standard deviation due to turbulent conditions in the neighbourhood of the atomiser nozzle.
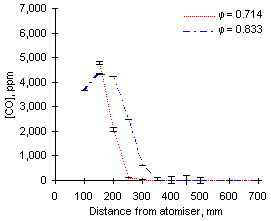
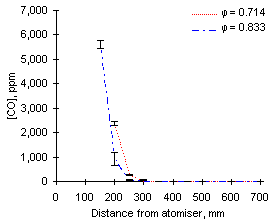
Graphs of CO concentration are shown in Figures 82 and 83. The most important feature of the CO readings obtained at 900 °C is the low concentrations observed at short distances when fuel M1 is burned at  = 0.833. This effect is thought to be due to CO being formed and destroyed as the flame progresses downward in the furnace. The peak value obtained at 150 mm from the atomiser nozzle reached 4,340 ppm.
| 
|
| Figure 82: CO concentrations from fuel M1 at 900 °C | Figure 83: CO concentrations from fuel G1 at 900 °C |
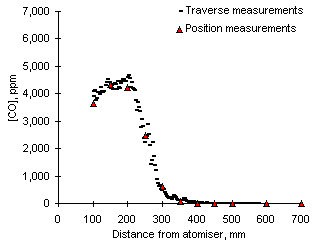
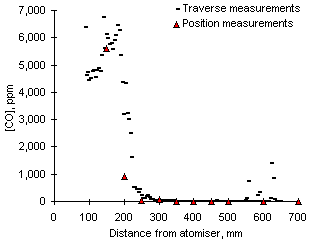
Peak values of CO were also observed in traverse experiments, in which continuous measurements were performed along the furnace tube. The following graphs show a comparison of traverse and measurements at stationary positions at 900 °C and  = 0.833 from both fuels investigated.
| 
|
Figure 84: Traverse and position measurements of CO from fuel M1 at 900 °C and  = 0.833 = 0.833
| Figure 85: Traverse and position measurements of CO from fuel G1 at 900 °C and  = 0.833 = 0.833
|
The peak of maximum CO concentration was almost coincidental with the location of the maximum flame temperature. Subsequent to the peak, the concentrations of carbon monoxide decreased until complete disappearance, as expected in an oxygen-rich atmosphere.
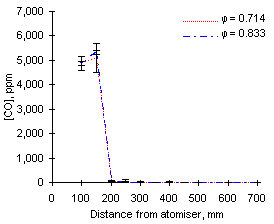
The results from carbon monoxide measurements at 1,100 °C from both fuels show a more rapid consumption of CO than at 900 °C. A peak in carbon monoxide concentrations (4,870 ppm) is also observed from fuel M1 at 150 mm from the atomiser nozzle. Subsequently, the values recorded decreased very rapidly to yield only 66 ppm at 200 mm from the atomiser nozzle (see Figures 86 and 87).
| 
|
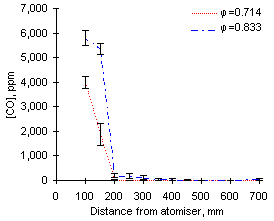
| Figure 86: CO concentrations from fuel M1 at 1,100 °C | Figure 87: CO concentrations from fuel G1 at 1,100 °C |
A similar rapid decrease in CO concentrations is also observed from fuel G1, although a peak of CO concentration could not be recorded.
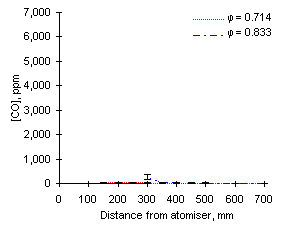
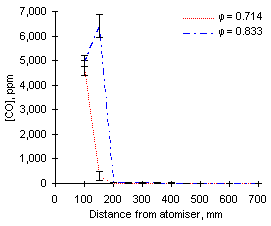
The formation and disappearance of CO is accelerated by a further increase of the furnace wall temperature, which, in turn, caused an increase of the flame temperature. This effect is particularly strong at  = 0.714, where formation and disappearance of CO is complete within the first 150 mm from the atomiser nozzle (see Figures 88 and 89 below). The large differences observed in these graphs are due to the lack of data for fuel M1 at short distances.
| 
|
| Figure 88: CO concentrations from fuel M1 at 1,200 °C | Figure 89: CO concentrations from fuel G1 at 1,200 °C |
 Previous |  Table of Contents |  Next |