4.4.8. N2O
Results of N2O measurements can only be considered accurate at  = 0.714 and 0.833. In stoichiometric and fuel-rich conditions, the high concentrations of CO caused interference with measurements of nitrous oxide. Experimental readings were negative, and it could not be established whether changes originated from varying concentrations of N2O or CO.
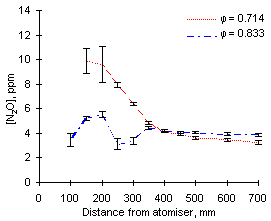
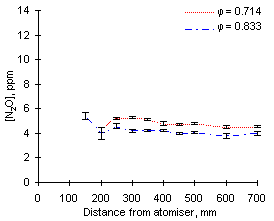
The measurements of N2O performed reveal a contradictory behaviour of this species. A clear trend of larger N2O concentrations at short distances and subsequent destruction was obtained in experiments with fuel M1 at  = 0.714 and other preliminary tests. However, such a trend was not found in experiments with fuel G1, as can be seen in Figures 90 and 91, although measurements could not be performed at distances lower than 200 mm.
| 
|
| Figure 90: N2O concentrations from fuel M1 at 900 °C
| Figure 91: N2O concentrations from fuel G1 at 900 °C
|
Trends of N2O concentrations at  = 0.833 were similar for both fuels investigated. A similar flat pattern can be observed from results with fuel G1.
Emissions of N2O were similar from both fuels, being between 3.5 and 4.5 ppm.
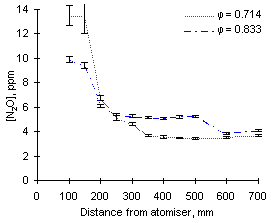
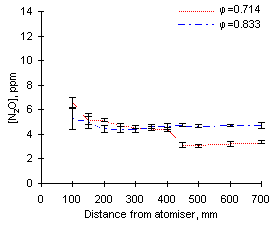
Similar contradictory results are obtained from N2O measurements at 1,100 °C, as can be observed in Figures 92 and 93. The instability of N2O measurements at short residence times, caused by the presence of rapidly changing amounts of carbon monoxide near the atomiser tip, is evidenced by the large standard deviation of such measurements.
| 
|
| Figure 92: N2O concentrations from fuel M1 at 1,100 °C
| Figure 93: N2O concentrations from fuel G1 at 1,100 °C
|
Figures 90 and 92 show that the disappearance of N2O formed at short distances is accelerated by an increase of the furnace wall temperature.
Emissions of N2O were again between 3 and 5 ppm.
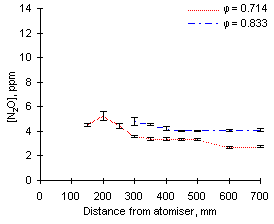
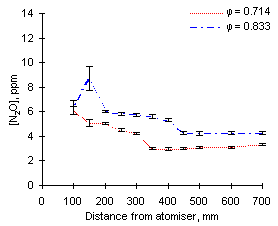
Experimental readings of N2O at 1,200 °C furnace wall temperature confirmed that this variable and, in turn, the flame wall temperature, exerts little influence on the emission of nitrous oxide. No significant change in the emissions of N2O was observed. These ranged between 2.8 and 3.5 ppm for fuel M1 and 4.0 and 4.7 for fuel G1.
| 
|
| Figure 94: N2O concentrations from fuel M1 at 1,200 °C
| Figure 95: N2O concentrations from fuel G1 at 1,200 °C
|
Sampling of solid particulates was attempted in experiments at 900 °C at fuel-rich conditions for periods of 20 minutes at selected probe positions. However, the mass of particulates collected in the cyclones from both fuels was very low, although not negligible, usually lower than 0.1 g. Such small amounts did not allow examination under the Scanning Electron Microscope. As a means of comparison, a standard residual fuel oil produces approximately 1 gram of solid particulates in the same conditions and time.
Since the lowest cyclone cut-off is 1.4 µm, smaller particles are expected to by-pass the cyclones in the form of a fine aerosol. This is shown by silica wool placed after the cyclones, which collects some of these smaller particulates.
Pollutant formation and interaction in the combustion of heavy liquid fuels
Luis Javier Molero de Blas, PhD thesis, University of London, 1998
© Luis Javier Molero de Blas
 = 0.714 and 0.833. In stoichiometric and fuel-rich conditions, the high concentrations of CO caused interference with measurements of nitrous oxide. Experimental readings were negative, and it could not be established whether changes originated from varying concentrations of N2O or CO.


