| 
|
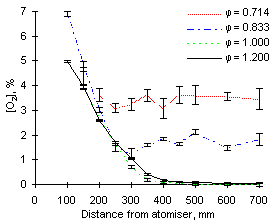
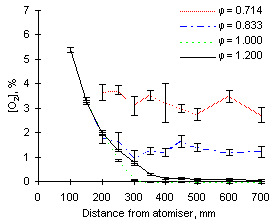
| Figure 70: O2 concentrations from fuel M1 at 900 °C | Figure 71: O2 concentrations from fuel G1 at 900 °C |
The results obtained on residual oxygen concentrations show the expected dependence on the amount of combustion air added. Increasing the equivalence ratio causes lower amounts of oxygen to be exhausted after combustion has been completed. At stoichiometric and fuel-rich equivalence ratios all oxygen is consumed.
The concentration of oxygen decreases very rapidly in the first 100 mm of the furnace. The first measurement of oxygen at such a distance yielded concentrations of oxygen at about 7 %. this implies the consumption of larger amounts of oxygen at low equivalence ratios than at high equivalence ratios.
Subsequently, concentrations of oxygen decrease further as combustion progresses along the furnace. The final amounts are reached at 400 mm from the atomiser nozzle.

| 
|
| Figure 70: O2 concentrations from fuel M1 at 900 °C | Figure 71: O2 concentrations from fuel G1 at 900 °C |
The amounts of excess oxygen measured in fuel-lean conditions range from 3.0 to 3.5 % at  = 0.714 and from 1.2 to 2.0 % at
  = 0.833. All oxygen was consumed at
  = 1.000 and 1.200.
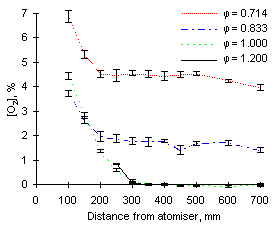
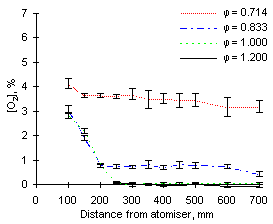
A higher furnace wall temperature seems to accelerate the consumption of oxygen (see Figures 72 and 73), as lower concentrations of oxygen were found at shorter distances. Also at this furnace wall temperature there was an increase of the amount of excess oxygen at  = 0.714. This increase also was observed at 1,200 °C furnace wall temperature.
| 
|
| Figure 72: O2 concentrations from fuel M1 at 1,100 °C | Figure 73: O2 concentrations from fuel G1 at 1,100 °C |
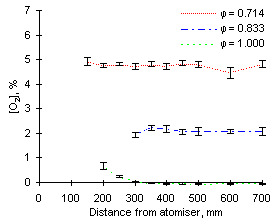
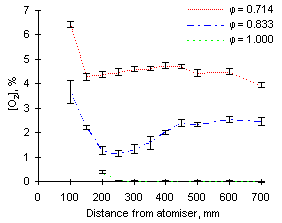
Increasing the furnace wall temperature up to 1,200 °C causes an increase of excess oxygen exhausted at fuel-lean conditions, especially at  = 0.714. The concentration of O2 in the exhaust gases of fuel G1 increased from 3.0 % at 900 °C to 4.2 % at 1,200 °C and
  = 0.714.
Also, the consumption of oxygen occurs at a faster rate than at lower furnace wall temperatures at all equivalence ratios investigated. Figures 74 and 75 show the oxygen concentration profiles at 1,200 °C furnace wall temperature.
| 
|
| Figure 74: O2 concentrations from fuel M1 at 1,200 °C | Figure 75: O2 concentrations from fuel G1 at 1,200 °C |
 Previous |  Table of Contents |  Next |