| 
|
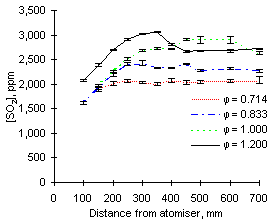
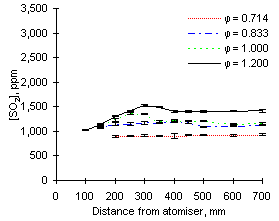
| Figure 64: SO2 concentrations from fuel M1 at 900 °C | Figure 65: SO2 concentrations from fuel G1 at 900 °C |
In general, the readings of SO2 at 900 °C reported increasing values as the equivalence ratio rose. This effect can be partly attributed to dilution by the higher amounts of air added at low equivalence ratios (see Figures 64 and 65).

| 
|
| Figure 64: SO2 concentrations from fuel M1 at 900 °C | Figure 65: SO2 concentrations from fuel G1 at 900 °C |
The exhaust concentrations of SO2 are also dependent on the initial sulphur content of the fuel. For example, at  = 0.714 the emissions of SO2 from fuel G1 (which contains 1.74 % sulphur) reach of 930 ppm. However, fuel M1 (3.59 % S) reaches 2,080 ppm SO2 at exhaust at the same equivalence ratio.
The trends presented in Figures 64 and 65 show that the concentration of SO2 increases steadily after injection. Formation of sulphur dioxide is rapid at fuel-lean equivalence ratios, especially at  = 0.714, where the exhaust values are reached before 200 mm. This represents a much shorter residence time than at any other set of conditions due to the large mass flow rate involved. At other equivalence ratios the final values of the concentration of SO2 were reached between 250 and 350 mm from the atomiser nozzle.
Readings in stoichiometric and fuel-rich conditions show a propensity to reach maximum values, followed by a decrease of SO2 concentrations. This tendency was observed to be stronger at higher furnace wall temperatures, and will be discussed later.
Comparison of results from both fuels at the same equivalence ratios show that SO2 from fuel M1 forms more slowly than that from fuel G1. When both fuels are burned at  = 1.000 and sampled at 150 mm from the atomiser, the readings of SO2 from fuel M1 only account for 68 % of the final emission, whereas 92 % of the total SO2 from fuel G1 is formed at that stage.
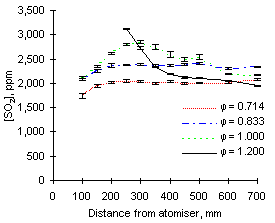
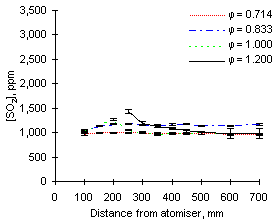
The graphs of SO2 concentration obtained from both fuels at 1,100 °C furnace wall temperature show different characteristics from those at 900 °C (see Figures 66 and 67).
| 
|
| Figure 66: SO2 concentrations from fuel M1 at 1,100 °C | Figure 67: SO2 concentrations from fuel G1 at 1,100 °C |
Experimental values registered from both fuels at 1,100 °C and fuel-lean conditions are almost identical to those obtained at 900 °C, showing that in excess of oxygen all sulphur is readily transformed into SO2.
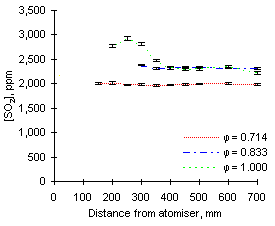
A different behaviour was found at  = 1.000 and 1.200. In these conditions the measured concentrations of SO2 also increased immediately after injection, reached maximum values between 200 and 300 mm, and decreased subsequently until the combustion gases exit the furnace. This effect, which implies reaction of SO2 along the furnace, was most accentuated in fuel-rich conditions, where the drop of SO2 concentration reached 30 % of the maximum values (1,171 ppm from fuel M1 and 457 ppm from fuel G1)
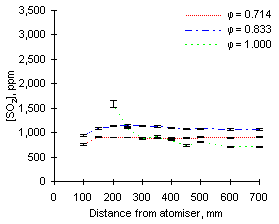
Readings of SO2 concentrations at 1,200 °C in fuel-lean conditions remained mostly unchanged with respect to those at 900 and 1,100 °C.
| 
|
| Figure 68: SO2 concentrations from fuel M1 at 1,200 °C | Figure 69: SO2 concentrations from fuel G1 at 1,200°C |
In stoichiometric conditions a maximum value was again found between 200 and 250 mm. The maximum value is followed by a sharp drop, which in the case of fuel G1 represents 50 % of the maximum SO2 concentration, from 1,586 to 710 ppm.
 Previous |  Table of Contents |  Next |