 = 1.200 from both fuels investigated. Emissions at fuel-lean conditions (
 = 0.714 and 0.833) were intermediate, whereas they were minimum at stoichiometric conditions, where formation and emission of both NO and NO2 was very low.
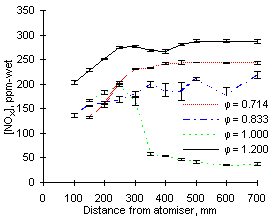
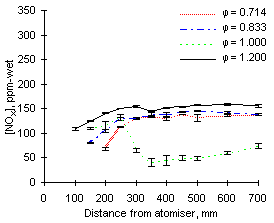
As can be seen in Figures 53 and 54, the highest values of NOX emissions were obtained at  = 1.200 from both fuels investigated. Emissions at fuel-lean conditions (
 = 0.714 and 0.833) were intermediate, whereas they were minimum at stoichiometric conditions, where formation and emission of both NO and NO2 was very low.
| 
|
| Figure 53: NOX concentrations from fuel M1 at 900 °C | Figure 54: NOX concentrations from fuel G1 at 900 °C |
Emissions at  = 1.200 are largely dominated by those of nitrogen dioxide as emissions of NO are minimum. Conversely, in fuel-lean conditions NO represent the most important fraction of NOX emissions and those of NO2 are negligible.
The concentration profile of NOX in stoichiometric conditions deserves particular attention. After an initial increase up to a distance of 250 mm a sharp drop ensues. Within the next 100 mm the concentration of NOX decreases to a fraction of its maximum value. Eventually, the emissions of NOX at  = 1.000 are much lower than at any other equivalence ratio.
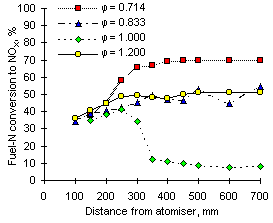
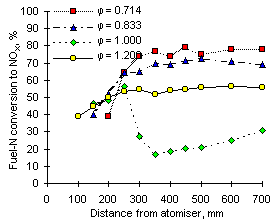
Calculations of the conversion of fuel-N into NOX offered a view of the experimental results from a different angle. The highest values were obtained at  = 0.714, but decreased as the equivalence ratio rose to stoichiometric conditions due to the lower formation of NO. In fuel-rich environments the conversion increased again to intermediate values, caused by low concentrations of NO but larger formation and emission of NO2.
Comparison of Figures 55 and 56 evidences that NOX conversion is inversely related to the fuel-N content. Higher values were obtained from fuel G1 (nitrogen content: 1,619 ppm) than from fuel M1 (nitrogen content: 3,231 ppm) at all equivalence ratios.
| 
|
| Figure 55: Conversion of fuel-N to NOX from fuel M1 at 900 °C | Figure 56: Conversion of fuel-N to NOX from fuel G1 at 900 °C |
It is worth noting that at short distances from the atomiser nozzle (less than 200 mm) fuel-N is converted into NOX to a similar extent at all equivalence ratios. The conversion in this early stages of the combustion process ranges between 35 and 45 % for fuel M1 and is higher (40 to 55 %) for fuel G1. Once again, it followed an inverse dependence with the fuel-N content.
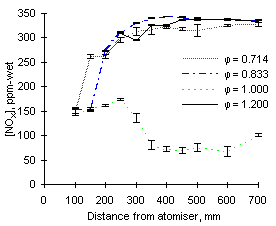
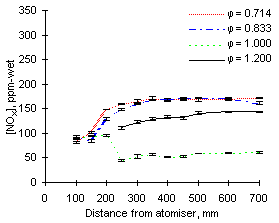
The experimental readings of NOX at 1,100 °C are shown in Figures 57 and 58. Again, formation and emission of NOX are higher for fuel M1 due to its high fuel-N content.
| 
|
| Figure 57: NOX concentrations from fuel M1 at 1,100 °C | Figure 58: NOX concentrations from fuel G1 at 1,100 °C |
NOX values are similar at all equivalence ratios except stoichiometric, which are much lower as NO is low in these conditions.
Increasing the furnace wall temperature from 900 to 1,100 °C causes an increase of NOX emissions, particularly at fuel-lean equivalence ratios. It also accelerates the formation of NOX at short distances; also in stoichiometric conditions the drop in NOX concentrations occurs at a higher rate.
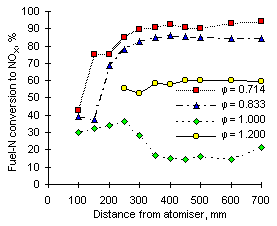
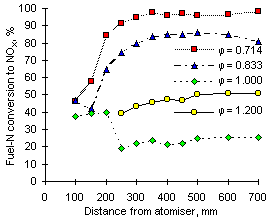
The following graphs show the conversion of fuel-N into NOX vs distance from the atomiser at 1,100 °C furnace wall temperature.
| 
|
| Figure 59: Conversion of fuel-N to NOX from fuel M1 at 1,100 °C | Figure 60: Conversion of fuel-N to NOX from fuel G1 at 1,100 °C |
The increase of the furnace wall temperature caused the conversion of fuel-N into NOX to rise at all equivalence ratios (a graph of conversion at exhaust is provided in Figure 63).
With the exception of fuel M1 at  = 1.200, both fuels show conversion of fuel-N into NOX at short distances to be similar at all equivalence ratios. This feature was also observed at 900 °C furnace wall temperature. At 1,100 °C furnace wall temperature conversions at different equivalence ratios start diverging at shorter distances than at 900 °C.
Also, calculations of the conversion of fuel G1 yielded slightly higher values than from fuel M1 at the same equivalence ratios.
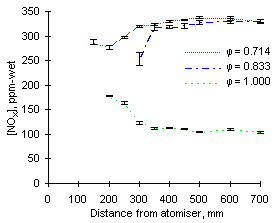
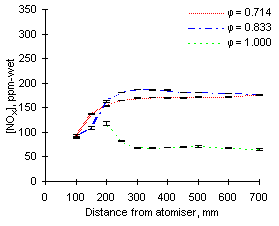
Another increase of NOX concentrations was registered at all equivalence ratios when the furnace wall temperature was increased from 1,100 to 1,200 °C. However, the increases were smaller than from 900 to 1,100 °C.
| 
|
| Figure 61: NOX concentrations from fuel M1 at 1,200 °C | Figure 62: NOX concentrations from fuel G1 at 1,200 °C |
At 1,200 °C the formation and decay of NOX concentrations in stoichiometric mixtures is greatly accelerated with respect to other experimental conditions. Maximum concentrations are formed at or before 200 mm from the atomiser nozzle.
Comparisons were made between experimental readings and the maximum calculated NOX emissions from the fuels investigated. Calculations of the latter yielded the results in the following Table:
| Equivalence ratio | M1 | G1 |
|---|---|---|
| 0.714 | 347 | 174 |
| 0.833 | 400 | 200 |
| 1.000 | 473 | 237 |
| 1.200 | 559 | 280 |
The dependence of fuel-N conversion to NOX with equivalence ratio, furnace wall temperature and fuel-N content can be seen in Figure 63.
The highest conversions were obtained at the leanest conditions ( = 0.714). Increases of the equivalence ratio led to decreasing conversion, with minimum values at
  = 1.000.
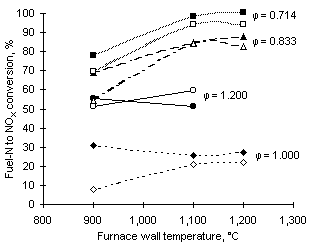
In fuel-rich conditions the conversion increased due to the greater formation of NO2.
An increase of the furnace wall temperature between 900 and 1,100 °C (and, in turn, the flame temperature) caused a sharp increase of the fuel-N conversion at fuel-lean equivalence ratios. The extent of the increase was smaller between 1,100 and 1,200 °C.
In stoichiometric and fuel-rich mixtures the conversion of fuel-N into NOX showed no dependence with the temperature of the furnace walls.
Higher values of the conversion were normally obtained from the fuel with lower fuel-N content, ie fuel G1, although this tendency was not seen at  = 1.200.
 Previous |  Table of Contents |  Next |