 = 0.833) = 0.833)
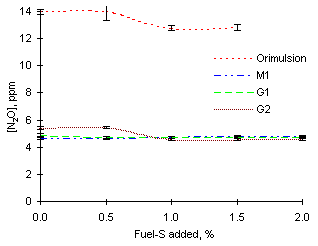 = 0.833
Addition of SO2 dopant did not seem to have a large effect on N2O emissions from any of the fuels studied at fuel-lean equivalence ratio (see Figure 146).
Emissions from Orimulsion reached 14 ppm in absence of SO2, whereas 12.8 ppm were measured when the dopant was added. However, both values are within the range of instrumental error.
Other fuels studied showed lower emissions of N2O. Fuel M1 produced 4.6 ppm without addition of SO2. Fuel G1 produced 4.9 ppm of N2O in similar conditions, whereas 5.4 ppm were formed from fuel G2. Minimum changes in N2O emissions were observed when SO2 was added to the combustion of these fuels. Only fuel G2 showed a somewhat significant decrease of 0.8 ppm on addition of 1 % fuel-S and greater.
= 1.000)
 = 1.000
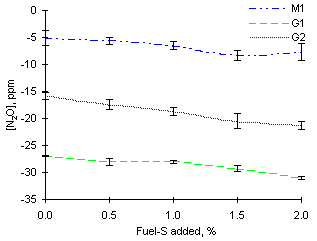
The instrumental readings of N2O decreased on addition of sulphur dopant in most cases. The rate of the decrease was inversely proportional to the initial sulphur content of the fuels. Thus, fuel M1 (3.59 % fuel-S) had its readings decreased from -5 ppm at a rate of 1.6 ppm per 1 % fuel-S added. Measurements from fuel G1 (2.20 % fuel-S) decreased from -26.9 ppm at a rate of 1.9 ppm per 1 % fuel-S added. Finally, values from fuel G2 (1.54 % fuel-S) decreased from -15.8 ppm at a rate of 2.8 ppm per 1 % fuel-S added.
However, the origin of these decreases remains unclear since the exact amounts of CO emitted are not known. Thus, the apparent decreases of N2O may be due either to the direct action of SO2 or to lower amounts of CO formed, also as a result of the addition of SO2. Although the CO and N2O gas analysers are equipped with a compensation setting, this is not sufficient to account for the interaction caused by very large amounts carbon monoxide, above 1 %.
= 1.200) Previous |  Table of Contents |  Next |