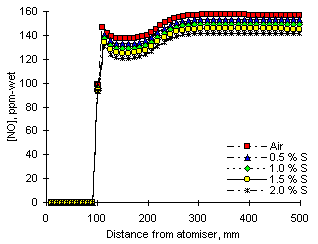
Figure 123: Numerical model calculations of NO formation from fuel M1 at
 = 0.833 and various degrees of fuel-S addition
The model was run as detailed in paragraph "2.2. Software, hardware and code implementation". The same temperature profiles as in the previous section were used in these sets of runs. It was assumed that addition of SO2 did not modify the flame temperature appreciably.

 = 0.833 and various degrees of fuel-S addition
Sulphur dioxide exerted some effect over the formation and emission of nitric oxide at all equivalence ratios studied.
One example of such an influence can be seen in Figure 123. It depicts the profile of NO concentration from fuel M1 in fuel-lean conditions ( = 0.833) and five different amounts of SO2 dopant.
According to the results from the numerical model the addition of SO2 does not cause significant changes to the pattern of NO concentration in the CSTR zone. However, on leaving this stage the presence of added SO2 was able to decrease the concentrations of NO. The decrease was larger for greater amounts of SO2 dopant.
In the subsequent stages the PFR flow regime tended to enhance the differences in NO concentrations. After a relatively small decrease, the concentrations of nitric oxide levelled off in the latter part of the PFR zone. The values of the emissions ranged between 157.2 ppm-wet (without SO2 addition) and 141.4 ppm-wet (with addition of 2.0 % fuel-S as SO2). Thus, the numerical model predicted decreases of NO emissions at fuel-lean conditions ( = 0.833) of 9.9 % at 2.0 % fuel-S added. A reduction of 4.8 % was achieved in the experimental work reported in chapter VII.
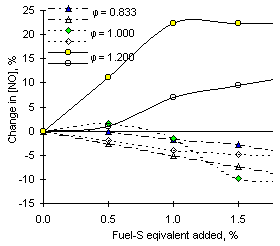
At  = 1.000 the calculated emissions of NO differed from the experimental values, as explained in previous paragraphs. However, the numerical model was able to predict reductions of the emissions of nitric oxide, which were intermediate between other equivalence ratios. The concentration of NO was decreased by 5.5 %, whereas a reduction of 10.1 % was achieved in experiments.
Similar to experimental results the mathematical model predicts enhancements of NO emissions in fuel-rich conditions ( = 1.200), up to 11.7 % over the emissions in the absence of SO2 dopant. However, the experimental readings of NO obtained at these conditions are very low, and thus the percentages do not represent a real change.
Comparison of the results from the numerical simulation of fuel M1 with the experimental results for the same fuel led to Figure 124 and Table 13.

| Equivalence ratio
0.833
| [NO]
|
| Figure 124: Effect of SO2 on NO emissions from fuel M1 at various equivalence ratios (experimental results: solid symbols; numerical simulation: open symbols) | Table 13: Qualitative effect of SO2 addition on emissions of nitric oxide from fuel M1 at various equivalence ratios | |
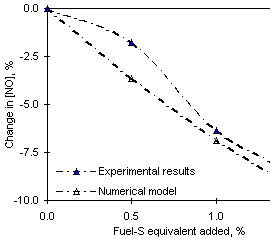
The results obtained from Orimulsion were closer to those from experiments. Figure 125 shows the calculated and experimental percentage decrease of NO emissions. The model predicted a decrease of 16.9 ppm-wet NO on addition of 1.5 % SO2. Although the calculated NO emission values were lower than experimental ones, similar percentage decreases were obtained from model and experiments.

 = 0.833 (experimental results: solid symbols; numerical simulation: open symbols)
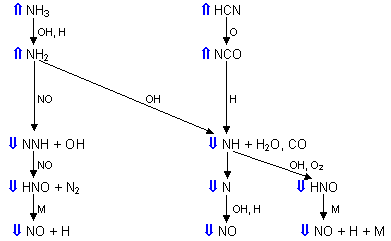
Examination of the results obtained at  = 0.833 from fuels M1 and Orimulsion show that the decrease of NO emissions on addition of SO2 is concurrent with increases in the concentrations of reduced N species, such as HCN (9.5 % from fuel M1, 16 % from Orimulsion, with respect to the results without the addition of SO2), NCO (approximately 4.4 % from both fuels), NH3 (23.7 % from both fuels) and NH2 (by an average 18 % from both fuels). These are transient species in the process of fuel-NO formation, but they can also be formed in recycle processes, such as the reaction of NO with hydrocarbons to form HCN.
At the same time, species that take part in reactions of formation of NO are decreased by the addition of sulphur as SO2. These species are N2H (by approximately 4 %, with respect to results without addition of SO2), HNO (approximately 13 %), NH (11 %), N (by an average 9 %).
In addition, the concentrations of O, OH and H radicals are decreased on incorporation of SO2 in the numerical model. The decrease was largest for OH radicals from Orimulsion, which were reduced by 30 % on addition of 1.5 % S with respect to the values obtained without addition of SO2. Decreases of O radicals were also obtained, which were of 2.8 % on addition of 1.5 % S to Orimulsion and 7.7 % on addition of 2 % S to fuel M1 over the values obtained without SO2 addition.
Also, a large increase of the concentration of NS radicals was observed (by 55 %) on addition of SO2, which shows the feasibility of the reduction of NO via:
 N2 + SO reac 70
Figure 126 shows various paths for the formation of fuel-NO (Hampartsoumian et al. (1991), Pfefferle and Churchill (1989)) . The effect that SO2 exerts on their concentrations is denoted by the blue arrows:

 = 0.833
The decrease of the concentrations of O and OH indicates that sulphur dioxide performs radical recombination under fuel-lean conditions. As a result, the concentrations of species that intervene in reactions prior to those with O and OH radicals, ie HCN, NCO, NH3 and NH2, are increased as channels for their reaction are blocked. The concentrations of species that are formed from reaction with O and OH radicals, ie N2H, HNO, NH, N and , ultimately NO, are reduced.
The interaction of N and S species will be studied experimentally in chapter VII.
 Previous |  Table of Contents |  Next |