 = 0.833) = 0.833)
= 1.000)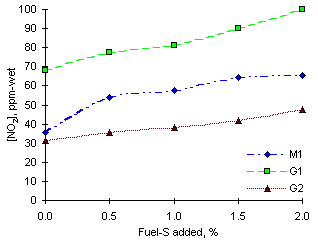 = 1.000
Experimental readings of NO2 in stoichiometric conditions were intermediate between those at other equivalence ratios.
Maximum readings of NO2 were obtained from fuel G1 (68.3 ppm-wet without SO2 injection), whereas fuel M1 produced intermediate values (35.6 ppm-wet) and fuel G2 gave the lowest readings (31.4 ppm-wet). A graph of the experimental readings can be seen in Figure 130.
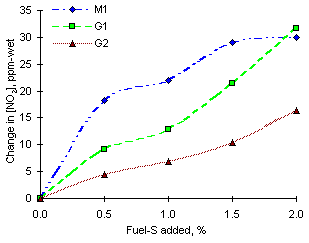
The effect of addition of sulphur dioxide in stoichiometric conditions is to cause a drastic increase of NO2 emissions from all fuels investigated. The nominal increases of NO2 emissions can be seen in Figure 131. This graph clearly shows that the largest increases of NO2 emissions were obtained from fuel M1, whereas smaller reductions were obtained from the heavy vacuum gas oils.
 = 1.000 from experiments of sulphur addition from the fuels investigated
Emissions from fuel G1 increased by 31.7 ppm-wet (ie 46.4 % of the emissions without addition of S) whereas G2 produced the smallest nominal increases of NO2 (16.3 ppm-wet, ie 52 %). The extent of the increase followed the order of nitrogen content of the fuels. The nitrogen content of fuel M1 is 0.32 %, whereas it is 0.13 % for fuel G1 and 0.06 % for fuel G2.
= 1.200)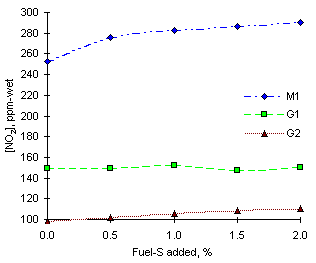 = 1.200
The experimental readings of nitrogen dioxide at fuel-rich conditions were highest among all conditions investigated. Fuel M1 (0.32 % N) produced 253 ppm-wet NO2 without the addition of SO2, whereas lower amounts were obtained from other fuels with lower nitrogen contents: 149 ppm-wet from fuel G1 (0.13 % N) and 98 ppm-wet from fuel G2 (0.06 % N). The experimental results are shown in Figure 132.
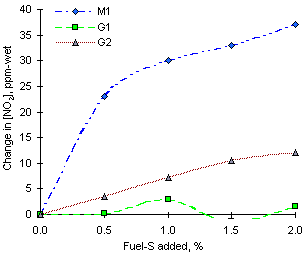
The effect of SO2 addition to the combustion system had varying results, according to the fuel. Fuels M1 and G2 experienced increases of NO2 emissions, whereas fuel G1 did not change its emissions appreciably.
Figure 133 shows this effect in greater detail. Fuel M1 showed increases of up to 37 ppm-wet on addition of 2 % fuel-S as SO2. This represented a 14.6 % increase over the figures in absence of SO2. Fuel G2 exhibited a smaller increase of NO2 emissions, 12.1 ppm-wet (6.4 % per 1 % S added), whereas fuel G1 had a negligible variation of NO2 emissions with SO2 addition.
 = 1.200 from experiments of sulphur addition from the fuels investigated
 Previous |  Table of Contents |  Next |